In this article
View 2 More +Note: This article’s statistics come from third-party sources and do not represent the opinions of this website.
For many people, pets are part of the family. They need plenty of attention, lots of care, and need to be provided for. From the cost of buying the pet, in the first place, to ongoing food costs and vet visits, the cost of owning any type of pet can add up to reach a surprisingly high amount.
In fact, it is estimated that a dog will cost its owner a total of $25,000 over its lifetime, although the actual figure can be higher or lower than this. This means that the $2,000 paid to buy a dog, in the first place, represents a fraction of the total lifetime cost.
Food is the biggest pet expenditure, accounting for about half of what we spend on our animals each year, with vet costs and vet services the next biggest outlay. Because of the large increase in pet ownership figures during the COVID-19 pandemic, Australia spent more than $33 billion on their pets in 2022 alone.
Below are 13 surprising Australian pet spending statistics, including figures on total expenditure and details on where that money goes.

The 13 Australian Pet Spending Statistics
- Generation Z spends the most per vet visit, while Baby Boomers spend the least.
- The cost of buying a dog or cat has doubled since before the pandemic.
- Dog owners spend an average of $3,218 a year on their pets.
- Cat owners spend an average of $1,715 a year on their pets.
- A dog will cost its owner approximately $25,000 over its lifetime.
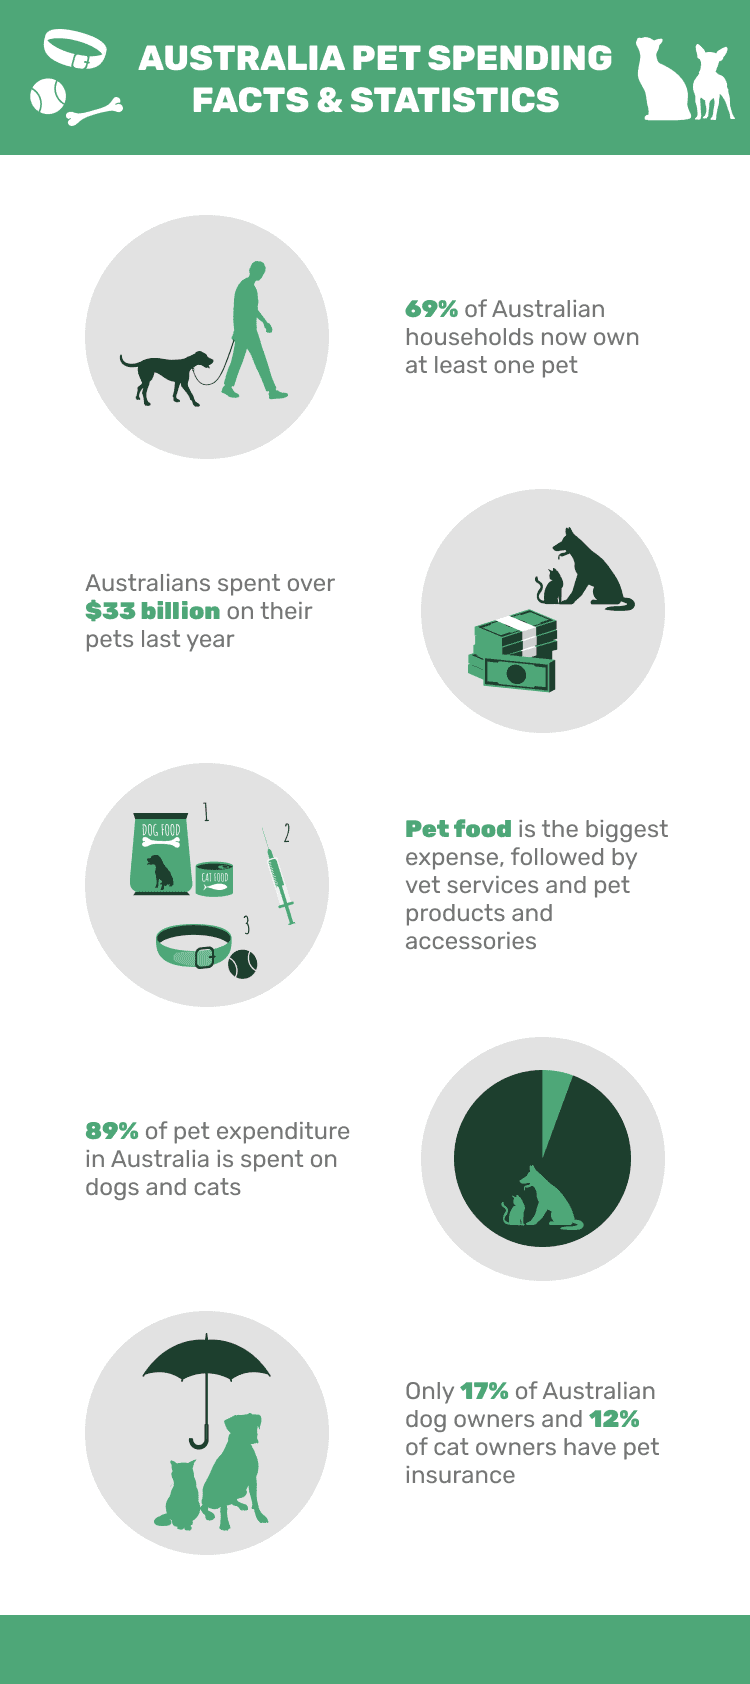
- Australians spent over $33 billion on their pets in 2022.
- Pet food was the biggest expenditure, followed by vet services and then pet products and accessories.
- 89% of pet expenditure is spent on dogs and cats.
- There are approximately 27 million pets nationwide.
- 69% of Australian households now own at least one pet.
- Nearly half of Australian households own a dog.
- There are more pet fish than any other animal, but dogs and cats have seen the biggest increases.
- Only 17% of dog owners and 12% of cat owners have pet insurance.
Pet Spend Specifics
1. Generation Z spends the most per vet visit, while Baby Boomers spend the least.
(Statista 3)
Generation Z are those that were born between the 1990s and the 2010s, and they are the generation that spends the most, per visit, on their pets. Generation Z owners spent an average of $630 per vet visit, while at the other end of the scale, Baby Boomers spent an average of $548 per visit.
2. The cost of buying a dog or cat has doubled since before the pandemic.
(PFIAA)
The pandemic saw many more people working from home and not having to go out to work. Lockdowns also meant people were unable to see friends and family, with pets being an even greater source of companionship during the Covid years. As a result, more people bought dogs and cats to keep them company, and with this increase in demand came an increase in cost. More than a third of new dogs now cost more than $2,000, compared to just 16% before the pandemic. More than 1 in 10 cats now cost more than $1,000, and prices have been reported to have doubled during this period.

3. Dog owners spend an average of $3,218 a year on their pets.
(RSPCA)
Dogs eat more, have high vet bills, and generally require more expensive toys and accessories than any other type of pet. As a result of this, they have the highest annual expenditure of any pet type and cost an average of $3,218 a year per dog, including all costs and fees.
4. Cat owners spend an average of $1,715 a year on their pets.
(RSPCA)
Cats do still require high-quality food, and they should be given toys and accessories to ensure they are physically and mentally fulfilled and happy. While the cost of keeping a cat is lower than keeping a dog, it still costs an average of $1,715 a year to keep a cat.
5. A dog will cost its owner approximately $25,000 over its lifetime.
(Real Insurance)
When taking into account all costs, including the cost of purchase, vet bills, food, and accessories, it is estimated that a dog will cost its owner $25,000 over its entire lifetime. This fee can be higher if a dog has illnesses or even if it is a large breed that requires more food.

General Pet Expenditure
6. Australians spent over $33 billion on their pets in 2022.
(Pet Food Industry)
As pet lovers, Australians spend a lot of money on their animals. In total, the nation spent over $33 billion on pet food, vet services, pet accessories, and healthcare products.

7. Pet food was the biggest expenditure, followed by vet services and then pet products and accessories.
(Pet Food Industry)
Of the $33 billion spent, 51% was spent on pet food, with 14% on vet services, 9% on accessories, and a further 9% on healthcare products. The remaining 17% was spent on insurance, alternative therapy sessions, and pet grooming services. When buying pet food, owners first consider what type of food their pet likes to eat and then the price. Almost a third of owners said that they prepare or cook treats or food for their pets, themselves.
8. 89% of pet expenditure is spent on dogs and cats.
(PFIAA)
The vast majority, or 89%, of all pet expenditure was spent on cats and dogs. Food for dogs and cats is typically more expensive than food for fish and birds, and owners spend more on treats as well as vet and insurance services, hence the larger outlay.

Pet Ownership in Australia
9. There are approximately 29 million pets nationwide.
(PFIAA)
Australia really is a nation of pet lovers. In 2022, following a big increase in pet ownership as a result of owners having more free time and extra time at home, there were 29 million pets across the country. This included 6.5 million dogs and 5.5 million cats, but these figures were dwarfed by the 11 million fish.

10. 69% of Australian households now own at least one pet.
(Pet Food Industry)
A staggering 69% of households across Australia own at least one pet of one sort or another, including cats, dogs, and fish. While there are many more fish, this is because the average fish owner keeps more fish than the average dog owner keeps dogs. Only 12% of households keep fish.
11. Nearly half of Australian households own a dog.
(Statista 1)
While 12% of households keep fish, 48% keep dogs, which is an increase from the 40% that kept dogs in 2019. 33% of households kept cats, which was also an increase from 2019, up from 27%. Other popular animals include birds, which were kept by 11% of households and just behind fish. 4% of households kept small mammals, and 1% kept other pets.

12. There are more pet fish than any other animal, but dogs and cats have seen the biggest increases.
(Statista 2)
While there are almost as many pet fish as dogs and cats combined, it was canine and feline companions that saw the greatest increase in ownership during the pandemic. In 2019, there were 5.1 million dogs compared to 6.3 million dogs in 2021. Cat numbers increased from 3.77 million to 4.9 million in the same period. Fish numbers actually decreased in this time, down from 11.33 million to 11.19 million.
13. Only 17% of dog owners and 12% of cat owners have pet insurance.
(RSPCA)
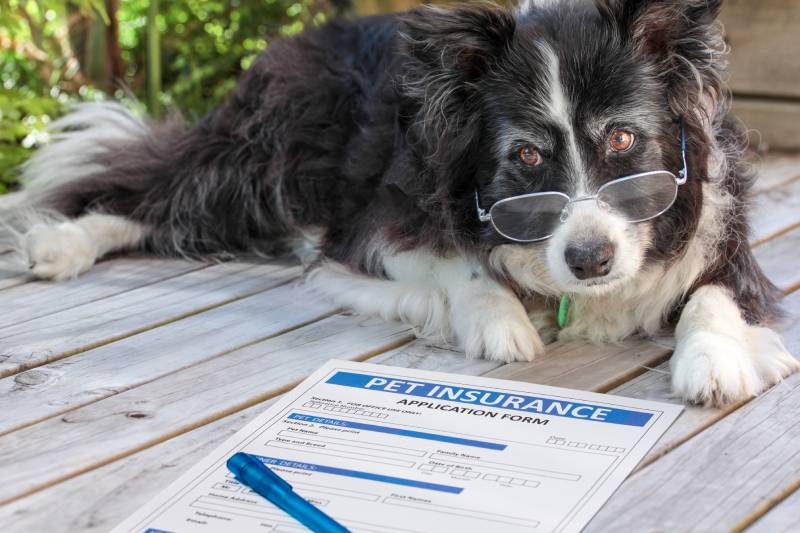
Despite vet bills and services being the second highest category of goods and services pet owners spend their money on, the majority of owners do not have insurance for their pets. In fact, 17% of households with a dog and just 12% of households with a cat say that they have pet insurance. The main reasons given for not having pet insurance are that policies cost too much and that they do not represent good value for money.
Frequently Asked Questions
Is pet insurance worth it?
Depending on the type of policy and the extent of its coverage, pet insurance can cover unexpected illnesses and injuries as a result of accidents. The policy will pay for vet treatment and may cover expenses such as medication and, in some cases, alternative therapies. Some treatments can cost several thousand dollars or more, and without pet insurance, owners have to pay all of these fees themselves. With pet insurance, the insurer will usually pay the majority, so pet insurance gives owners the peace of mind that they won’t have to worry about the financial aspects of treatment for their pets. Hopefully, you will never need to call on your pet insurance policy. If you do need to, it can make a difficult time easier.
What is the most common pet in Australia?
The most common pet in Australia, by the total animal population, is the fish. There are more than 11 million pet fish. However, in terms of the number of household owners, the dog is the most popular pet because 48% of households own at least one dog.
How can you save money on pet spending?
There are various ways to save money on pet spend without sacrificing the care you provide your pet. Buy and stock up on food when it is on offer, and consider making your own homemade, healthy, affordable treats instead of buying expensive commercial products. Look at wellness and preventive care programs to see whether they can save you money on treatments like deworming and flea products. If you have insurance, shop around to ensure you get the best deal and try to take advantage of multi-pet and other discounts to get even lower prices.
 Final Thoughts
Pets can enrich and improve people’s lives, and their companionship was proven during Dovid lockdowns when many owners turned to their pets in lieu of being able to see family and friends outside their own households. However, pets—whether they are small mammals or horses and farm livestock—do cost money to keep. Australians spent more than $33 billion on their pets last year, with the majority going on food but a decent portion being spent on vet services and pet products and accessories. Dogs cost nearly twice as much as cats over their respective lifetimes, but all animals do have a cost.
Related Read:
